graph
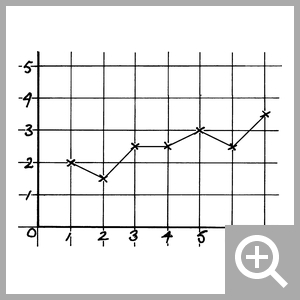
Longman Dictionary of Contemporary English 5++LDOCE 5++graph /ɡrɑːf $ ɡræf/ ●●● S3 W2 noun [countable] HMa drawing that uses a line or lines to show how two or more sets of measurements are related to each other 图表,曲线图 → chart Martin showed me a graph of their recent sales. 马丁给我看了他们最近销售情况的图表。n COLLOCATIONSNOUN + grapha bar graph (=a picture of boxes of different heights, in which each box represents a different amount or quantity)The monthly variations in rainfall are shown on the bar graph below.a line graphA line graph is a way of presenting figures in visual form.verbsdraw a graphDraw a graph to show changes in the death rate over this period.plot something on a graph (=to draw marks or a line to show facts, numbers etc on a graph)The different values can be plotted on a graph.show something on a graph/a graph shows somethingThe graph shows that wages rose in line with productivity. →5 see picture at 见图 chart1
Examples from the Corpus
graph• We can map out our budget and time performance on a graph.• Other products are treated in the same way, building up a graph of the aggregate sales of existing products.• How many graphs and charts will viewers look at?• This may be in the form of a report containing written evidence, diagrams or graphs as appropriate.• The oscilloscope graph of both voices was flattened in the lower register: tension was restricting the movement of their vocal chords.• If you do not get a satisfactory graph, try resetting the graph settings to the default.• Allow the graph to dry overnight before hanging it up.• Together, the graphs sum up what happened during the intervening eighty years.• The graph on page 6 shows population growth over the past 50 years.From Longman Business Dictionarygraphgraph1 /grɑːfgræf/ noun [countable] a drawing that uses a line or lines to show the relationship between two or more sets of figures, measurements etcYou can use visuals such as charts and graphs to enhance your presentation. → compare chart1 → bar graph → line graphgraphgraph2 verb [transitive] American English to draw a line or lines on a graph, showing the relationship between two or more sets of figures, measurements etcUsing the above data, graph the demand for wheat and the supply of wheat.Origin graph (1800-1900) graphic formulagraph noun →n COLLOCATIONS1LDOCE OnlineChinese
Corpus line or a uses a that Business lines drawing
See ldoce4116jpg for more
graph
graph S3 /ɡrɑːf $ ɡræf/
 noun [countable]

Martin showed me a graph of their recent sales.
■ NOUN + graph
▪a bar graph (=a picture of boxes of different heights, in which each box represents a different amount or quantity) The monthly variations in rainfall are shown on the bar graph below.
▪a line graph A line graph is a way of presenting figures in visual form.
■ verbs
▪draw a graph Draw a graph to show changes in the death rate over this period.
▪plot something on a graph (=to draw marks or a line to show facts, numbers etc on a graph) The different values can be plotted on a graph.
▪show something on a graph/a graph shows something The graph shows that wages rose in line with productivity.
graph S3 /ɡrɑːf $ ɡræf/
noun [countable] Date: 1800-1900
Origin: graphic formula
a drawing that uses a line or lines to show how two or more sets of measurements are related to each other ⇨ chart:Origin: graphic formula
| COLLOCATIONS |
▪
▪
■ verbs
▪
▪
▪
also
Referring to a chart, graph or table 描述图或表
◆ This bar chart illustrates how many journeys people made on public transport over a three-month period.这个柱状图显示三个月期间人们乘坐公共交通往来的次数。 ◆ This table compares bus, train, and taxi use between April and June.这个表比较了四月至六月公交车、火车和出租车的使用情况。 ◆ The results are shown in the chart below.结果显示在下面的图表中。 ◆ In this pie chart, the survey results are broken down by age.在这个饼分图中,调查结果按年龄划分。 ◆ This pie chart breaks down the survey results by age.这个饼分图按年龄对调查结果进行分类。 ◆ As can be seen from these results, younger people use buses more than older people.从结果可以看出,年轻人比老年人乘坐公交车的频率更高。 ◆ According to these figures, bus travel accounts for 60% of public transport use.从这些数字看,乘坐公交车出行占公共交通使用率的 60%。 ◆ From the data in the above graph,it is apparent that buses are the most widely used form of public transport.从上图的数据明显看出:公交车是公共交通中使用最广泛的类型。